
CASE
The goal of this project was to analyze Customer Lifetime Value (CLV) using machine learning techniques.
The challenge was handling a skewed distribution, distinguishing between one-time and repeat spenders, and ensuring the model’s predictions aligned with real-world business needs.
However, the dataset revealed that most customers had a frequency of 1, leading to poor feature importance for frequency-based metrics.
- Kaggle notebook: Here
WHY
This is an individual project from Kaggle that I worked on to practice my data science skills.
Understanding CLV is critical for:
- Targeted Marketing: Identifying high-value customers for special promotions.
- Revenue Forecasting: Predicting future revenue streams.
- Customer Retention: Detecting potential churn among repeat customers.
The objective is to develop a predictive model that estimates Customer Lifetime Value (CLV) based on past transactions, how recently they purchased despite the dataset’s limitations in capturing frequency effects.
The whole code & work can be found from Kaggle notebook : Here
WORKFLOW
- Collection of data from Kaggle Brazilian department store Olist’s dataset
- Exploratory data analysis
- Data preprocessing & Feature engineering
- Model & Prediction
- Evaluation
- Business Insights
DATASET OVERVIEW
- Customers: This table contains information about the customer and their location.
- Orders: This table contains information about the orders’ status (i.e., if they were delivered), order purchased date, delivery date, delivery estimate date, and date when the order was delivered to the carrier.
- Order_payment: This table contains information about the payment options, installments, and payment value.
EXPLORATORY DATA ANALYSIS
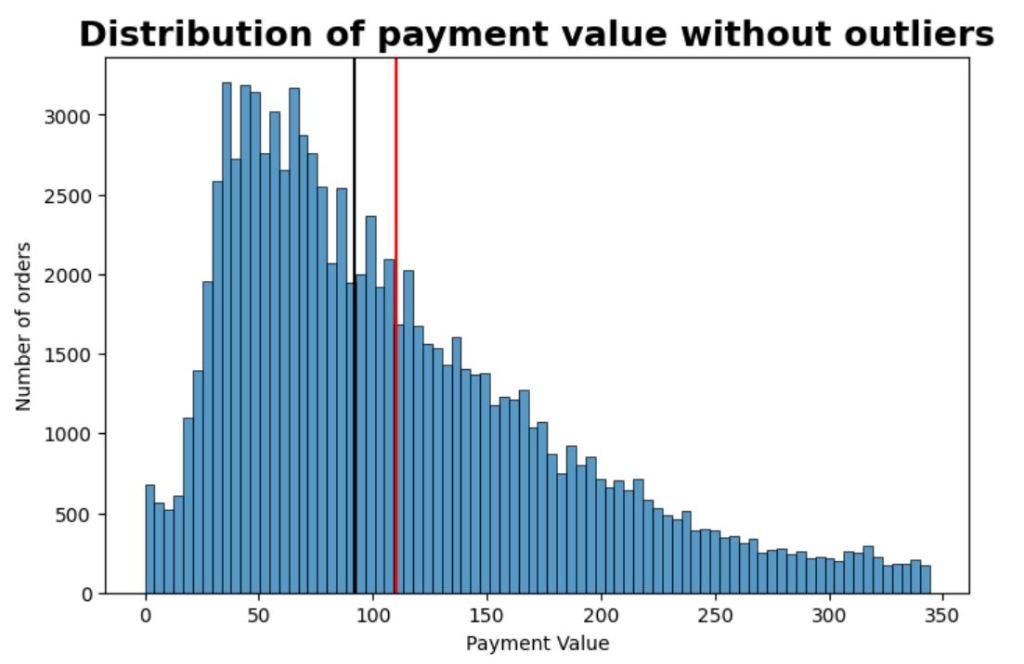
The graph shows the distribution of payment value captured from ‘order_payment’ table. I removed the outliers.
DATA PREPROCESSING
- Handling Missing Values: Replaced missing values where necessary.
- Filtering Zero-Spend Customers: Removed customers who did not make any purchases during the observed period to improve regression performance.
- Feature Engineering:
- Created a recency-based metric to assess engagement due to the lack of repeat purchases.
- Created an average order value to assess
# Average value per order
df_features['avg_order_value'] = df_features['monetary'] / (df_features['frequency'] + 1e-5)

# A ratio between recency and frequency
# This might capture the importance of a recent buyer:
# a customer who bought only once but very recently might be more promising than
# a customer who bought once a long time ago.

df_features['recency_frequency'] = df_features['recency'] / (df_features['frequency'] + 1e-5)
MODEL & PREDICTION
Baseline Models Tested
- Linear Regression: Performed poorly due to the highly skewed nature of the data.
- XGBoost: Provided better results but struggled with extreme values.
- Gamma Regression: Chosen as the final model due to its effectiveness in handling positive continuous values.
Final Model Selection & Why
- Model:
Gamma Regression (reg:gamma) - Hyperparameter Tuning:
n_estimators=300,learning_rate=0.05,max_depth=5
- Reason for Selection:
- Gamma regression models positively skewed data well.
- XGBoost-based tuning improved accuracy while preventing overfitting.
# Build and train the XGBRegressor

model = xgb.XGBRegressor(
    objective="reg:gamma",
    n_estimators=300,
    learning_rate=0.05,
    max_depth=5,
    random_state=321
)

model.fit(X_train, y_train)
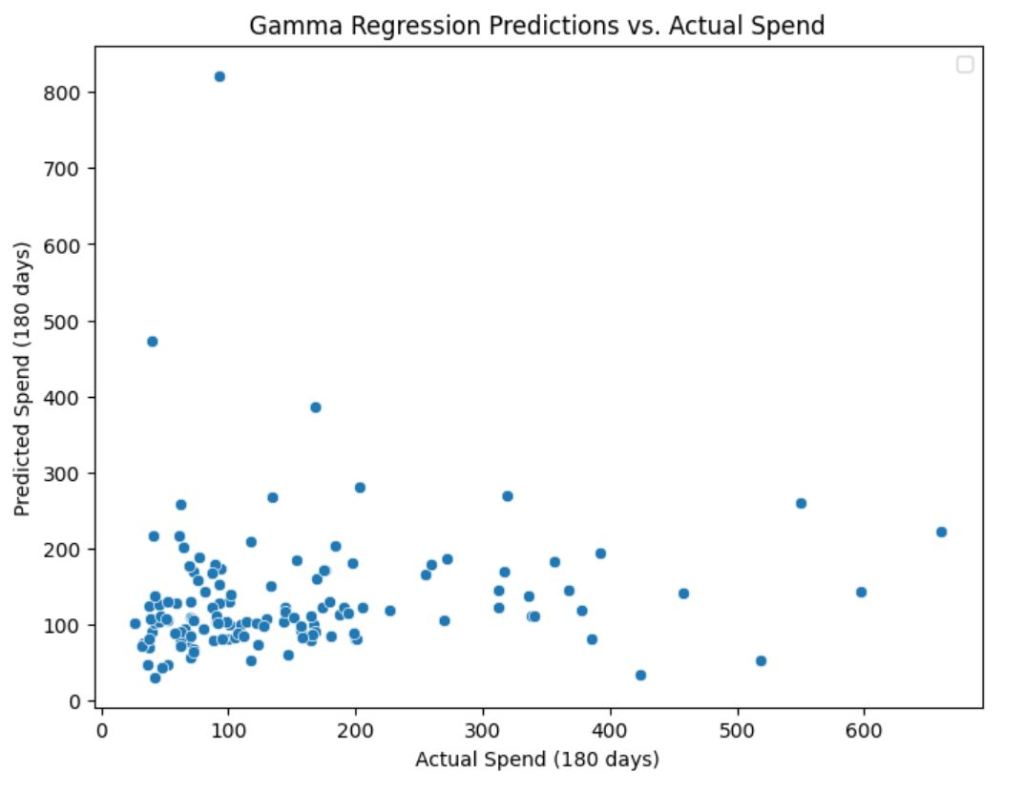
Scatterplot Analysis
- Actual vs. Predicted Spend Scatterplots showed an improvement in spend predictions over earlier models.
- The model correctly captured spending patterns but underestimated some high spenders.
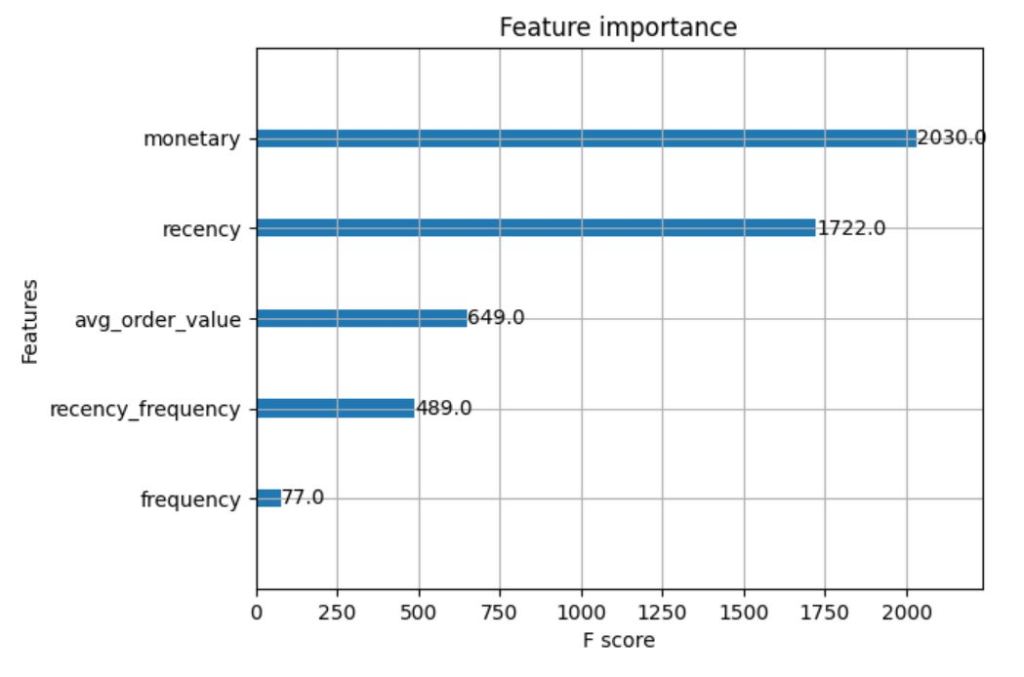
FEATURE IMPORTANCE
EVALUATION
Key Metrics
- RMSE (Root Mean Squared Error): Lower than baseline models.
BUSINESS INSIGHTS & RECOMMENDATIONS
Key Findings
- High-value customers tend to have high monetary spend and recent transactions, rather than high purchase frequency.
- One-time spenders dominate the dataset, making traditional CLV models less effective.
- AOV and recency are more reliable than frequency-based segmentation for predicting high-value customers.
How Businesses Can Use These Insights
- Prioritize High Monetary & Recency Customers: Target customers with high spend and recent transactions instead of focusing on frequency.
- Segment Customers by AOV Instead of Frequency: Since frequency is mostly 1, AOV provides a better method for differentiating high vs. low-value customers.
- Revise CLV Calculation Approach: Given the frequency limitation, businesses should consider alternative CLV models that emphasize spend and recency.
Limitations & Future Improvements
- Apply Quantile Regression: To better capture high-spender variability.
- Explore Additional Features: Such as demographic data or external economic factors.
📁 Want to see more projects like this? 🚀 View my portfolio
FINAL TAKEAWAYS
Lessons Learned
- Monetary Value and Recency Are Stronger CLV Indicators Than Frequency.
- Gamma Regression handled skewed spend data effectively, making it a suitable choice for continuous positive target variables.
- Traditional RFM-based CLV modeling is ineffective when frequency is mostly 1, requiring alternative approaches.
Next Steps
- Refine feature selection to improve high-spender predictions.
- Explore alternative CLV models that do not rely on frequency.
Conclusion: This project analysed CLV using advanced machine learning techniques, handling data skewness, and applying meaningful feature engineering despite dataset limitations. The insights gained can drive actionable business strategies in marketing.
- Kaggle notebook: Here
💼 Looking for a data analyst?
I specialise in turning raw data into actionable insights using SQL, Python, and Power BI.
