
CASE
The project aims to predict the price of each house in Iowa. There are 79 independent variables in the data set.
- Kaggle notebook: Here
WHY
This is an individual project from Kaggle that I worked on to practice my data science skills.
I built advanced regression models to predict the final price of each house with 79 independent variables.
The whole code & work can be found from Kaggle notebook : Here
WORKFLOW
- Collection of data from Kaggle Titanic dataset consisting of Train & Test data
- Exploratory data analysis
- Data preprocessing
- Model & Prediction
- Evaluation
- Submission
EXPLORATORY DATA ANALYSIS
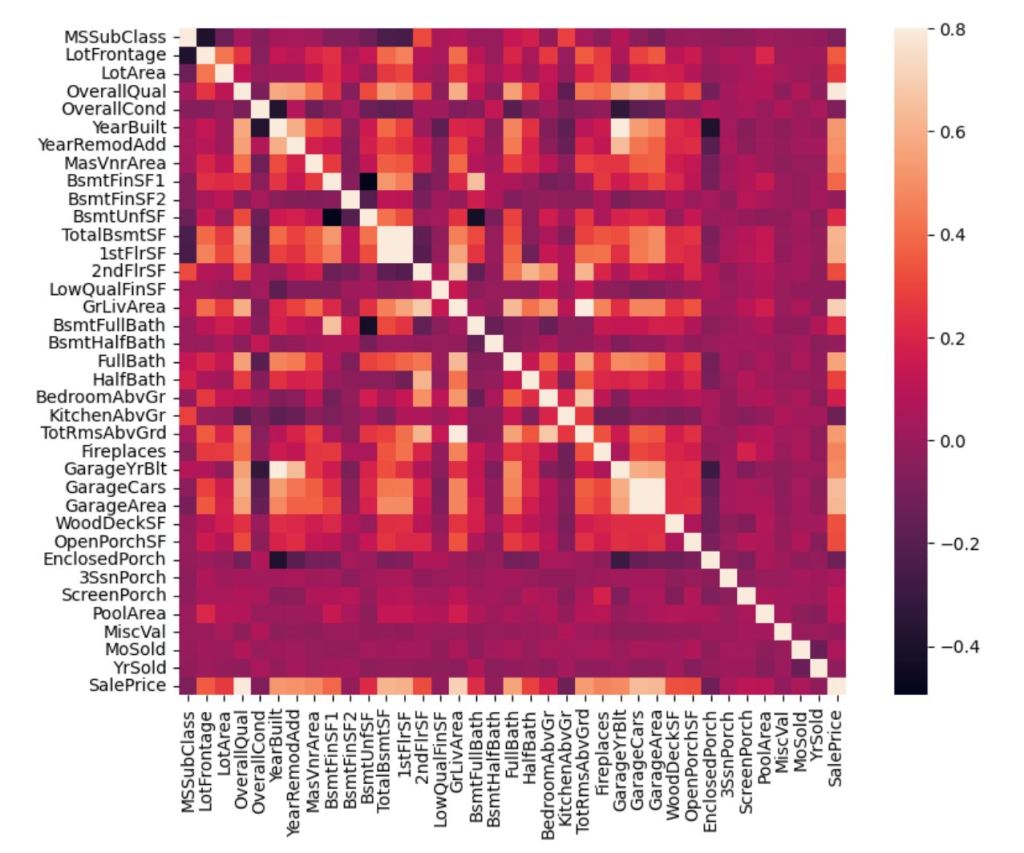
This is the screenshot of matrix that shows the correlation among independent variables. The strong correlation exhibites variable ‘GarageYrBlt’ & ‘YearBuilt’, ‘TotalBsmtSF’ & ‘1stFlrSF’, ‘TotRmsAbvGrd’ & ‘GrLivArea’, ‘GarageArea’ & ‘GarageCars’.
DATA PREPROCESSING
Analysis of Dependent variableDealing with outliersDealing with missing valueNormalisation of dependent variableFeature creationCreate new feature
Feature transformationsConversion of data typesNormalisation of numierical featuresEncoding categorical features
skew_features = all_X[Numerical].apply(lambda x: skew(x)).sort_values(ascending=False)

high_skew = skew_features[skew_features > 0.5]
skew_index = high_skew.index

print("There are {} numerical features with Skew > 0.5 :".format(high_skew.shape[0]))

skewness = pd.DataFrame({'Skew' :high_skew})
skew_features.head(10)
MODEL & PREDICTION
- Cross validation
- Ridge
- Lasso
- Elastic net
- Random forest
- GBR
- XGBoost
- LightGBM
# Hyperparameter Tuning

lgbm = LGBMRegressor(boosting_type='gbdt',
                     objective='regression',
                     n_estimators=5000,
                     num_leaves=4,
                     learning_rate=0.01,
                     max_depth=2,
                     lambda_l1=0.0001,
                     lambda_l2=0.001,
                     min_child_samples=10,
                     feature_fraction=0.4,
                    verbose= -1)

# Scoring

score = cv_rmse(lgbm)
print("lgbm score: {:.4f} ({:.4f})".format(score.mean(), score.std()))
scores['lgbm'] = (score.mean(), score.std())

# Fitting a model

lgbm_model = lgbm.fit(train_X, train_y)
print('lgbm')

# Training a model

lgbm_train_pred = lgbm_model.predict(train_X)
lgbm_pred = np.expm1(lgbm_model.predict(test_X))
print(rmsle(train_y, lgbm_train_pred))
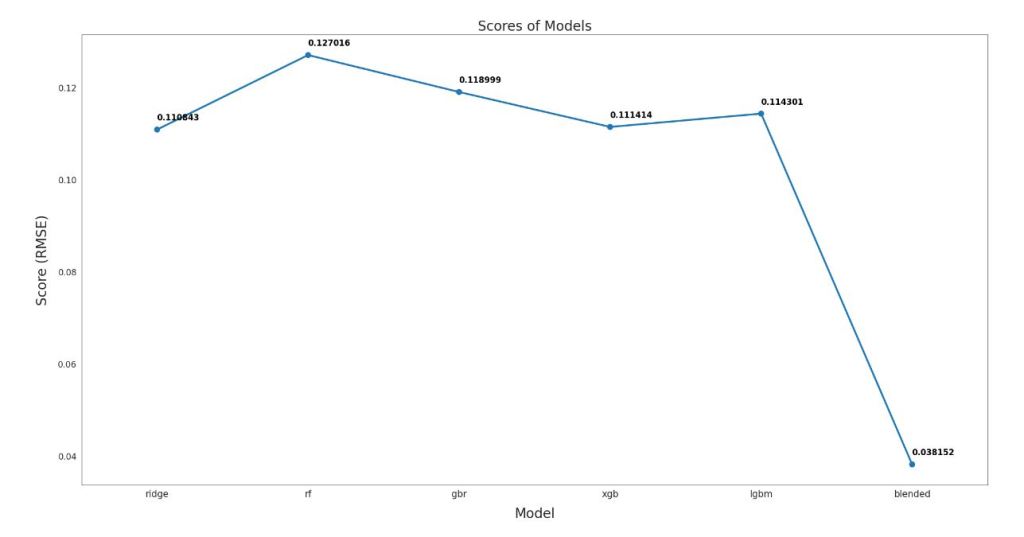
EVALUATION
Based on scores above, we can sort the scores of all the models.
We decide to use
The whole code & work can be found from Kaggle notebook : Here
💼 Looking for a data analyst?
I specialise in turning raw data into actionable insights using SQL, Python, and Power BI.
