CASE
“The Relationship between the Rhetoric related to Trades taken from UN General Assembly Debates and Income Inequality”
- Research Paper at UCL
- Github page: Here
WHY
While Trade is believed to have driven economic development some argued that it achieved negative impacts such as increase of income inequality and level of poverty. Using text extracted from UN General Debates, I wanted to examine the influence of international trade on income distribution.
METHODOLOGY
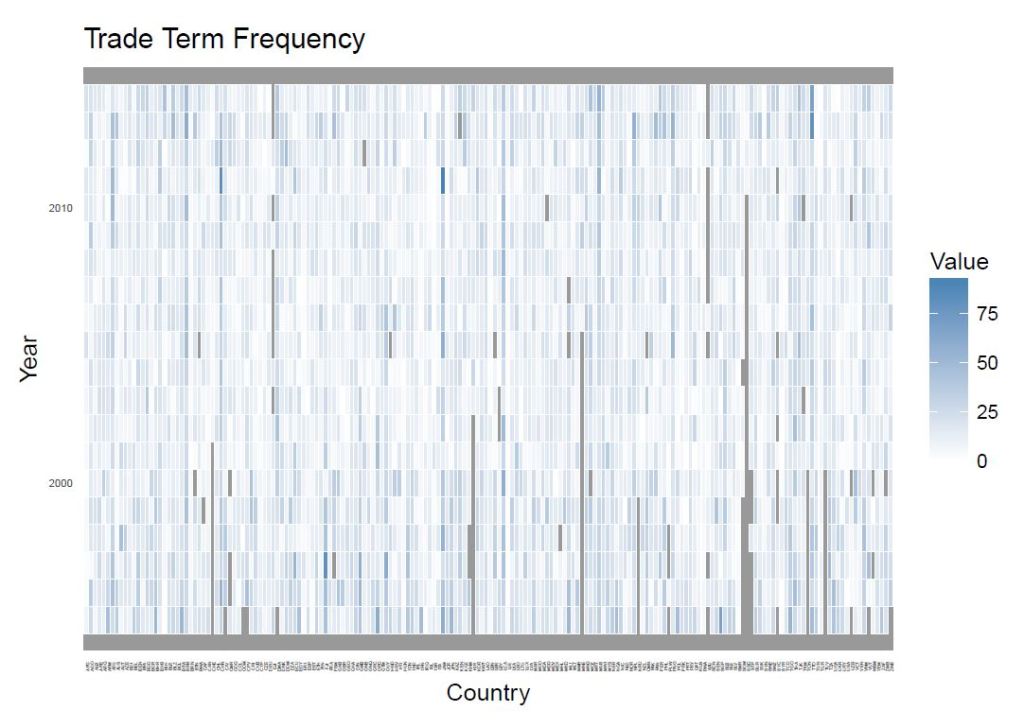
- Collection of data from World Development Indicator (WDI) and UN General Debates texts
- Cleaning & Wrangling data
- Model & Prediction
- Evaluation
HYPOTHESES
Dependent variable:
- Poverty headcount ratio (the percentage of the population living on less than 1.90 US dollars a day at 2011 international prices)
- Gini Index (the extent to which the distribution of income among individuals or households within an economy deviates from a perfectly equal distribution)
- Income share held by each quantile (share that accrues to subgroups of population indicated by deciles or quintiles)
Independent variable:
- Words-frequency shared in UN general assembly debates from 1995 to 2014
Control variables:
- Taxes on trade
- Trade openness
- Unemployment rate
- Population growth rate
- Log of population
- GDP per capita growth rate
- Log of GDP per capital
Null Hypothesis (H0): There is relationship between words frequency in UN General Assembly debates from 1995 to 2014 relating to trades and dependent variables.
H1: There is no relationship between words frequency in UN General Assembly debates from 1995 to 2014 relating to trades and poverty headcount ratio.
H2: There is no relationship between words frequency in UN General Assembly debates from 1995 to 2014 relating to trades and income share differences.
H3: There is no relationship between words frequency in UN General Assembly debates from 1995 to 2014 relating to trades and Gini Index.
MODEL & PREDICTION
I carried out the following machine learning technics to conduct research on this topic.
- Linear regression
- Generalized additive models (GAM)
- Ridge regression
- Lasso
- Principal Components Regression (PCR)
- Partial Least Squares (PLS)
- Boosting
- Bagging
- Random Forest
# Boosting
library(gbm)
set.seed(11)

pows <-  seq(-10, 0.2, by=0.1)
lambdas <-  10 ^ pows

length.lambdas <-  length(lambdas)
TrainErrors <-  rep(NA, length.lambdas)
TestErrors <-  rep(NA, length.lambdas)

for (i in 1:length.lambdas) {
  boost.Fit <-  gbm(Poverty ~ ., data=TrainData,
                        distribution="gaussian",
                        n.trees=1000,
                        shrinkage=lambdas[i])
  train.pred <-  predict(boost.Fit, TrainData, n.trees=1000)
  test.pred <-  predict(boost.Fit, TestData, n.trees=1000)
  TrainErrors[i] <-  mean((TrainData$Poverty - train.pred)^2)
  TestErrors[i] <-  mean((TestData$Poverty - test.pred)^2)
}

plot(lambdas, TrainErrors, type="b", xlab="Shrinkage", ylab="Train MSE", ylim=c(0, 150), col="blue", pch=20)

min(TestErrors)
lambdas[which.min(TestErrors)]

boost.best <-  gbm(Poverty ~ .,data=TrainData,
                   distribution="gaussian", n.trees=1000,
                   shrinkage=lambdas[which.min(TestErrors)])
#summary(boost.best)

boost.pred <-  predict(boost.best, TestData, n.trees=1000)
boost.rss <-  mean((TestData$Poverty - boost.pred)^2)
boost.rss
boost.tss <-  mean((TestData$Poverty - mean(TestData$Poverty))^2)
boost.r2 <-  1 - boost.rss / boost.tss
boost.r2
boostFit <- gbm(as.factor(Poverty) ~ trade +
                        Log_GDPpc +
                        GDPpcGrowth +
                        Log_Pop +
                        PopGrowth +
                        Unem +
                        Trade +
                        Log_Tax,
                      data=TrainData, distribution="gaussian", n.trees=1000, shrinkage=lambdas[which.min(TestErrors)])

summary(boostFit)

# Bagging

library(randomForest)
set.seed(11)

bag.Fit <-  randomForest(Poverty ~ ., data=TrainData,
                            ntree=1000, mtry=8, importance=TRUE)
bag.pred <-  predict(bag.Fit, TestData)
bag.rss <-  mean((TestData$Poverty - bag.pred)^2)
bag.rss
bag.tss <-  mean((TestData$Poverty - mean(TestData$Poverty))^2)
bag.r2 <-  1 - bag.rss / bag.tss
bag.r2

#varImpPlot(bag.Fit)

# Random Forest

library(randomForest)

set.seed(11)
rf <-  randomForest(Poverty ~ ., data=TrainData, n.trees=1000, importance=TRUE)
#rf
rf.pred <-  predict(rf, TestData)
rf.rss <-  mean((TestData$Poverty - rf.pred)^2)
rf.rss
rf.tss <-  mean((TestData$Poverty - mean(TestData$Poverty))^2)
rf.r2 <-  1 - rf.rss / rf.tss
rf.r2

rfFit <- randomForest(as.factor(Poverty) ~ trade +
                        Log_GDPpc +
                        GDPpcGrowth +
                        Log_Pop +
                        PopGrowth +
                        Unem +
                        Trade +
                        Log_Tax,
                      data=TrainData, na.action = na.omit, importance = TRUE)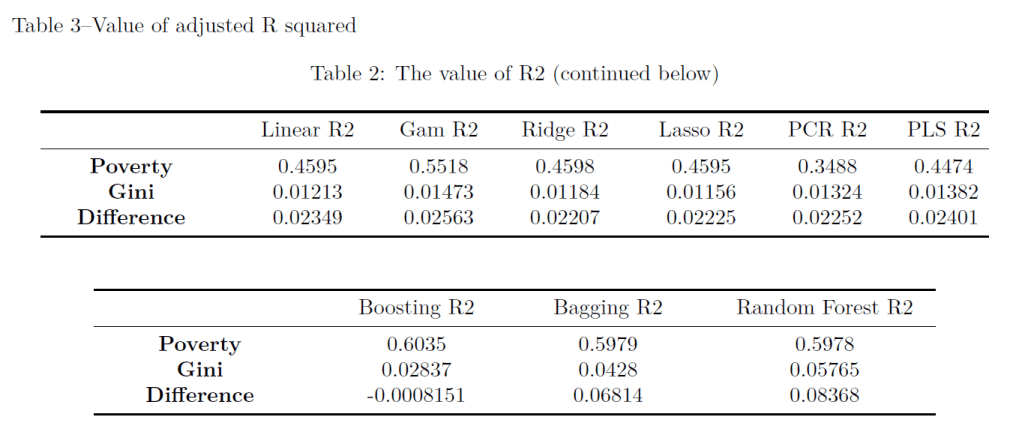
RESULT & CONCLUSION
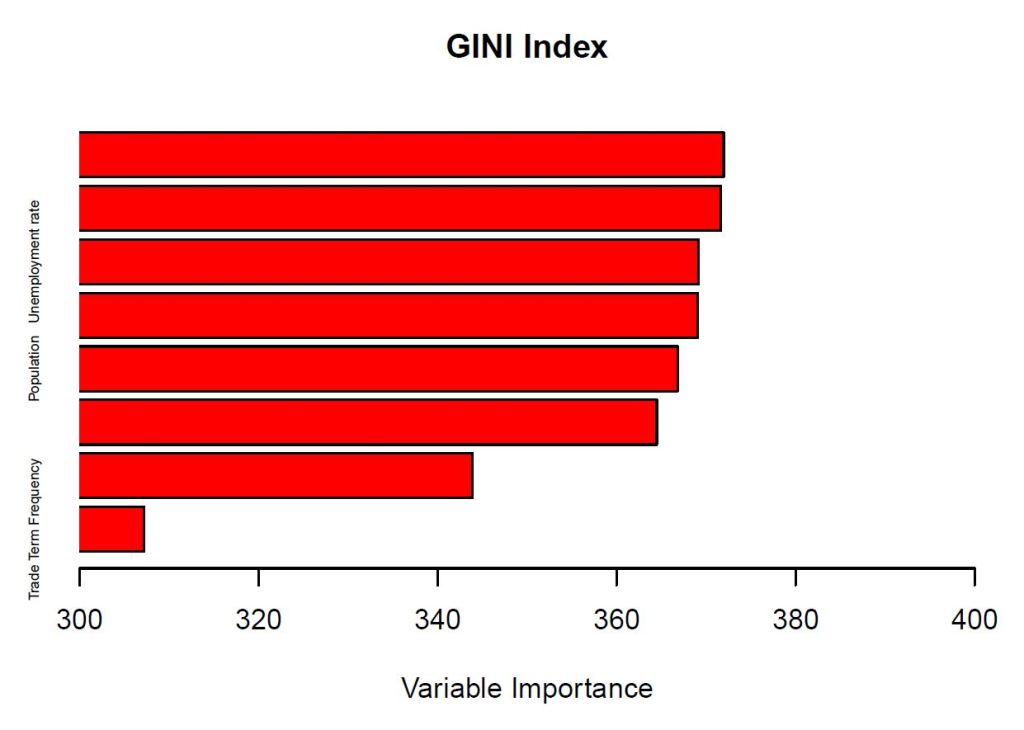
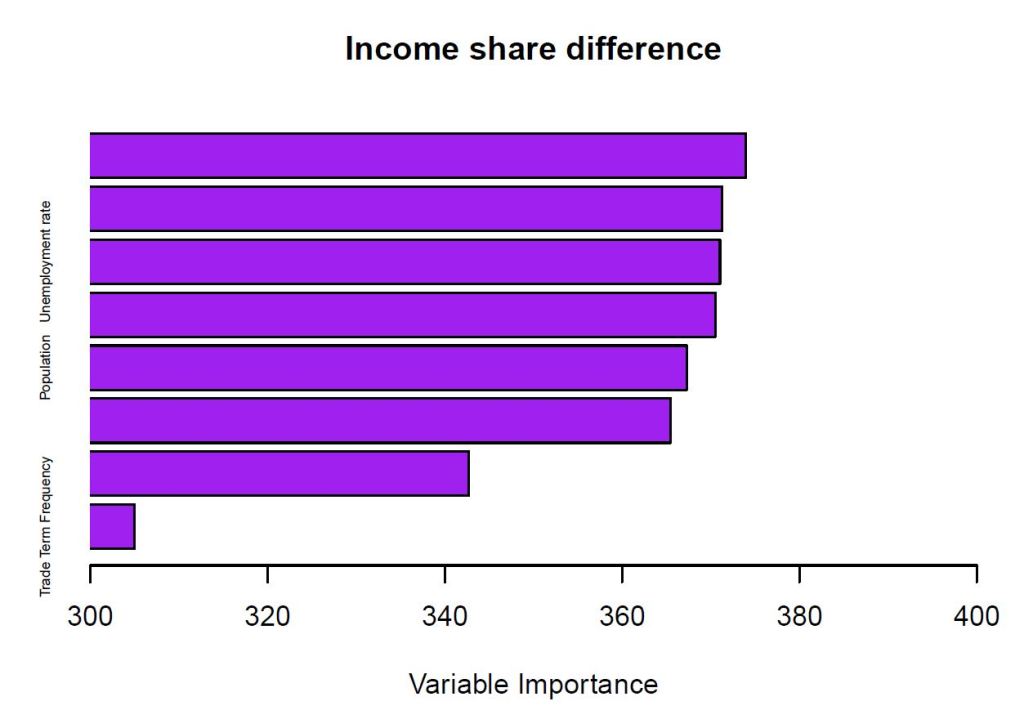
The frequency of Trade term is the least important variable, and it is suggested that we fail to reject the hypotheses 1, 2 and 3. We find that there are no statistically
significant relationships. Though log of GDP per capita and population growth rate are the most important variables on poverty ratio.
The rhetorics related to trade and economic development articulated during UN
General Debates did not have significant influences on poverty ratio and income inequality.
💼 Looking for a data analyst?
I specialise in turning raw data into actionable insights using SQL, Python, and Power BI.
