
CASE
“What sorts of people were more likely to survive?” during the Titanic tregedy.
- Kaggle notebook: Here
WHY
This is an individual project from Kaggle that I worked on to practice my data science skills.
I built a predictive model to predict which passenger was more likely to survive during the sinking of Titanic.
The whole code & work can be found from Kaggle notebook : Here
WORKFLOW
- Collection of data from Kaggle Titanic dataset consisting of Train & Test data
- Exploratory data analysis
- Cleaning & Wrangling data
- Model & Prediction
- Evaluation
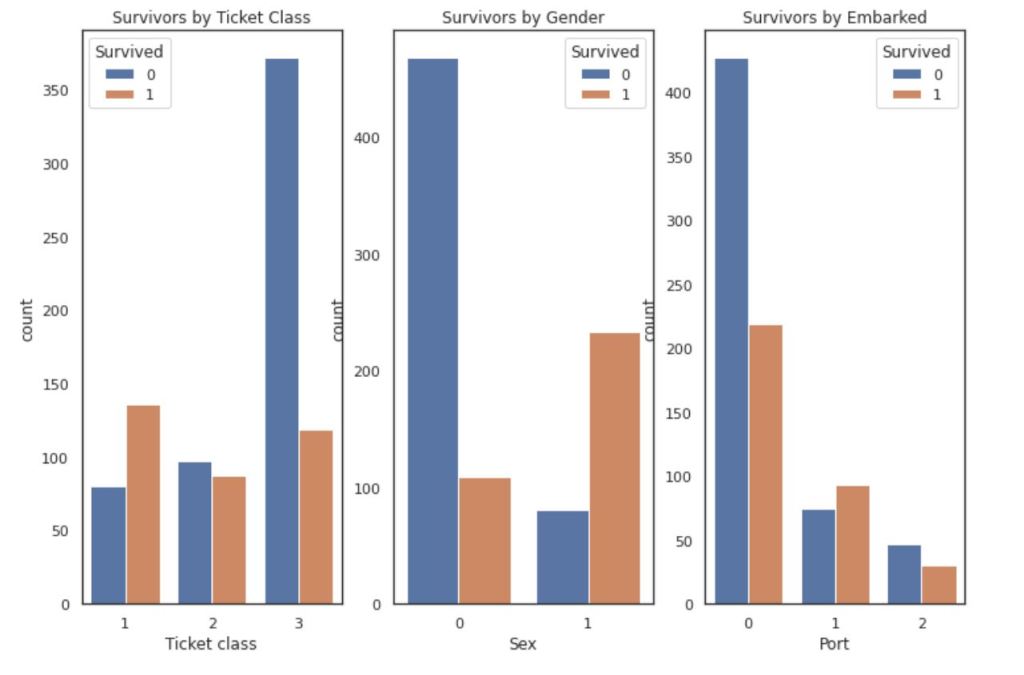
EXPLORATORY DATA ANALYSIS
CLEANING DATA
- correcting by dropping
- completing by dealing with missing value
- converting it to numeric
- creating new feature
data_train['Age'].fillna(value=data_train['Age'].mean(), inplace=True)
data_test['Age'].fillna(value=data_test['Age'].mean(), inplace=True)
MODEL & PREDICTION
# Random Forest Classifier
RF = RandomForestClassifier()
RF.fit(X_train, y_train)
y_pred = RF.predict(X_test)
acc_RF = round(RF.score(X_train, y_train) * 100, 2)
acc_RF
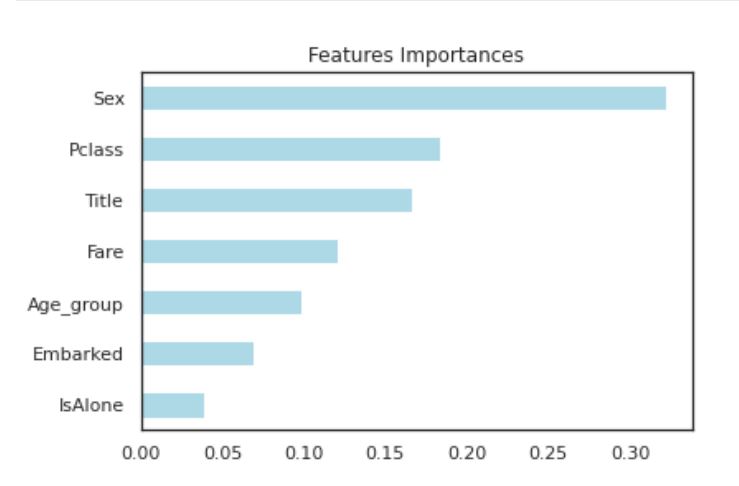
# Feature importance
importances = pd.Series(data=RF.feature_importances_, index=X_train.columns)
importances_sorted = importances.sort_values()
importances_sorted.plot(kind='barh', color='lightblue')
plt.title('Features Importances')
plt.show()
EVALUATION
Based on scores above, we can sort the scores of all the models.
While both Decision Tree and Random Forest have the same scores (86.87), we decide to use Random Forest as they correct for Decision tree’s habiot of overfitting to the training set.
The whole code & work can be found from Kaggle notebook : Here
